 |
Virtualization Blog - Performance Statistics in Virtual Iron |  |
|
Performance Statistics in Virtual Iron
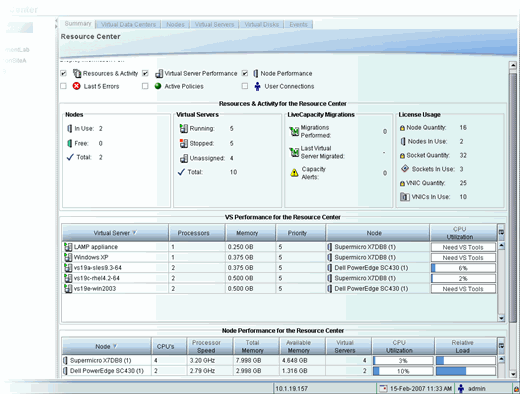
The Virtual Iron Virtualization Manager gives you easy access to performance statistics on virtual servers and nodes:
You can choose to display a variety of statistics at the same time. The screenshot above shows virtual server and node performance. Both of these are rolled up into the resources and activities section. I could have just as easily chosen to show different statistics simply by checking what I want to show up. The Virtualization Manager collects and displays statistics information for four different areas: - Resource Center Statistics For each area, you can choose the type of information that is displayed. For example, you can choose to show the most recent errors or active policies. I find that referring to the performance statistics is the easiest way to see a summary of my virtual datacenter. |
||
|
FuseTalk Standard Edition - © 1999-2007 FuseTalk Inc. All rights reserved.
Copyright © 2003-2007 Virtual Iron Software, Inc. | Privacy Statement | Terms of Use | Site Map


